Hospital leaders, compliance directors, and institutional safety advocates now have a powerful patient safety dashboard at their fingertips. The innovative National Healthcare Safety Dashboard serves as a robust hospital patient safety dashboard designed to assess, analyze, and improve hospital safety data. Developed through the collaboration of federal agencies and private partners, this dashboard will help hospitals benchmark their performance against the current state of patient and workforce safety.
Background on the Patient Safety Dashboard
Launched in December 2024, the National Healthcare Safety Dashboard is a comprehensive tool that focuses on some of the most consequential hospital safety data metrics impacting patient safety nationwide. By aggregating data from four key sources, this hospital patient safety dashboard provides granular details on specific safety events, clinical indicators, and patient survey responses across four broad categories.
Three of the four dashboard categories are sourced from the Agency for Healthcare Research and Quality (AHRQ), and the other one comes from the Centers for Medicare and Medicaid Services (CMS). The four data sources include:
- Hospital Patient Safety Indicators (AHRQ).
- Hospital Medicare Adverse Events (AHRQ).
- Hospital Reporting Program Safety Measures (CMS).
- Surveys on Patient Safety Culture (SOPS) Hospital Survey (AHRQ).
While the patient safety dashboard currently focuses on hospital-based metrics, AHRQ officials have indicated plans to expand its scope to ambulatory settings and nursing homes. This hospital patient safety dashboard is a creation of the National Action Alliance for Patient and Workforce Safety (NAA), a collective of federal agencies and private partners formed within AHRQ in 2023 that seeks to meet the stated goals of AHRQ’s National Advisory Council to reduce patient and workforce harm by 50% by 2026.
The NAA supports five primary tactics to meet national goals in reducing patient safety adverse events and “help all healthcare systems strengthen their patient and workforce safety outcomes.” The five aims include:
- Conducting self-safety assessments to assess a baseline measure of performance.
- Empowering patient feedback to steer strategic aims (e.g., allowing patients’ safety concerns to flow into facilities’ event reporting systems).
- Redesigning the workplace and team units to support workforce safety.
- Strengthening the training of all workforce members in safety competencies.
- Promoting research, learning, and process-sharing (e.g., harm reduction strategies) across networks.
The hospital safety data aggregated by the NAA is essential for tracking progress and measuring improvements in Adverse Events in Hospitals and other key indicators. “The National Healthcare Safety Dashboard is one approach to tracking our progress on patient and workforce safety nationally using measures prioritized by national programs,” the NAA states.
A Closer Look at the Data
Each of the four key data sources that comprise this patient safety dashboard contains sub-elements that delve into the latest national measures – providing a benchmark that facilities can use as they start on, or continue, their journey to enhanced harm reduction. In all cases, the charts and tables present the latest available federal data. The following section provides a closer look at the primary data categories and their sub-elements.
Hospital Patient Safety Indicators
This category includes more than a dozen condition- or event-related safety indicators, as follows:
- Death rate in low-mortality diagnosis related groups (DRGs) (PSI-02)
- Pressure ulcer rate (PSI-03)
- Iatrogenic pneumothorax rate (PSI-06)
- Central venous catheter-related bloodstream infection rate (PSI-07)
- In-hospital fall with hip fracture rate (PSI-08)
- Postoperative hemorrhage or hematoma rate (PSI-09)
- Postoperative acute kidney injury requiring dialysis rate (PSI-10)
- Postoperative respiratory failure rate (PSI-11)
- Perioperative pulmonary embolism or deep vein thrombosis rate (PSI-12)
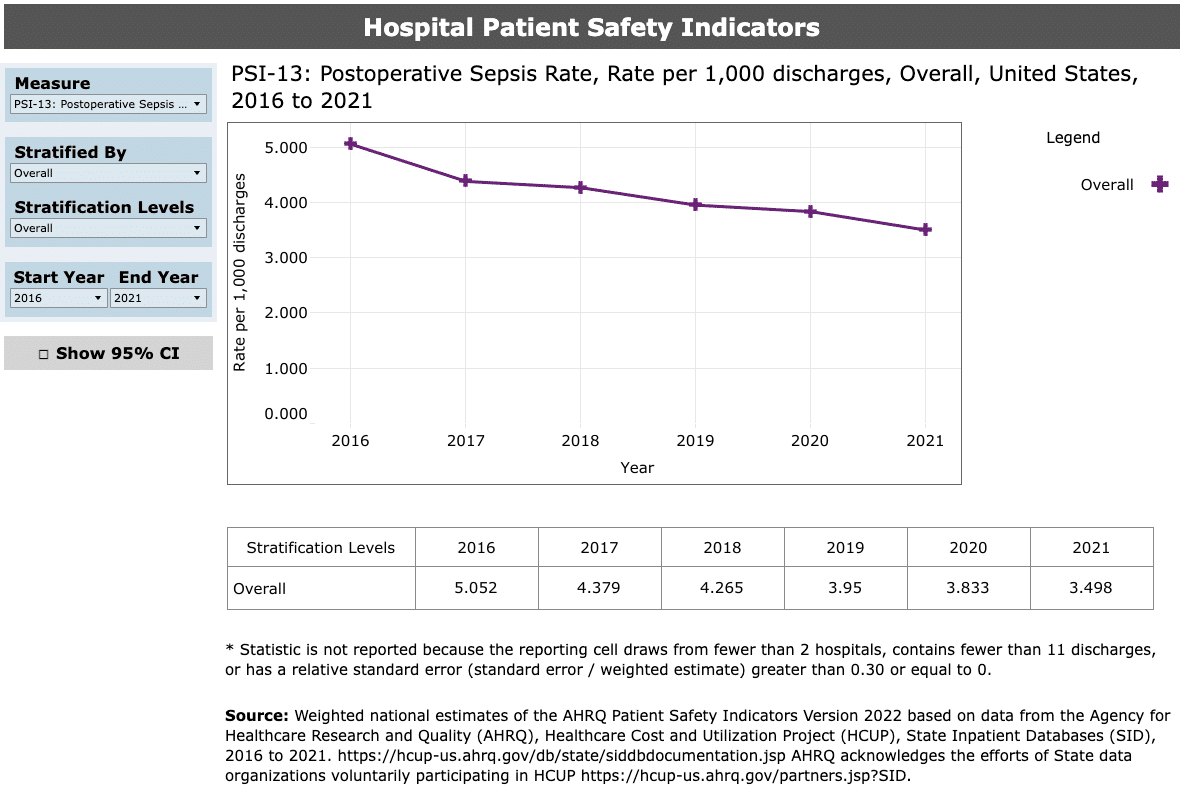
- Postoperative sepsis rate (PSI-13)
- Postoperative wound dehiscence rate (PSI-14)
- Abdominopelvic accidental puncture or laceration rate (PSI-15)
- Birth trauma rate – injury to neonate (PSI-17)
If you navigate through the data sets, you’ll find overall risk stratification levels for the various safety indicators. For instance, the post-operative sepsis rate shows a rolling national risk level from the period between 2016 and 2021, during which time facilities saw a significant reduction in post-op sepsis rates, decreasing from five cases per 1,000 discharges to about three-and-a-half cases per 1,000. Users can also mine the data further, stratifying the data based on patient variables (e.g., age group, expected payer, patient sex).
Facilities like ADN’s clients using the Clinical Benchmarking System have access to this type of benchmarking data already.
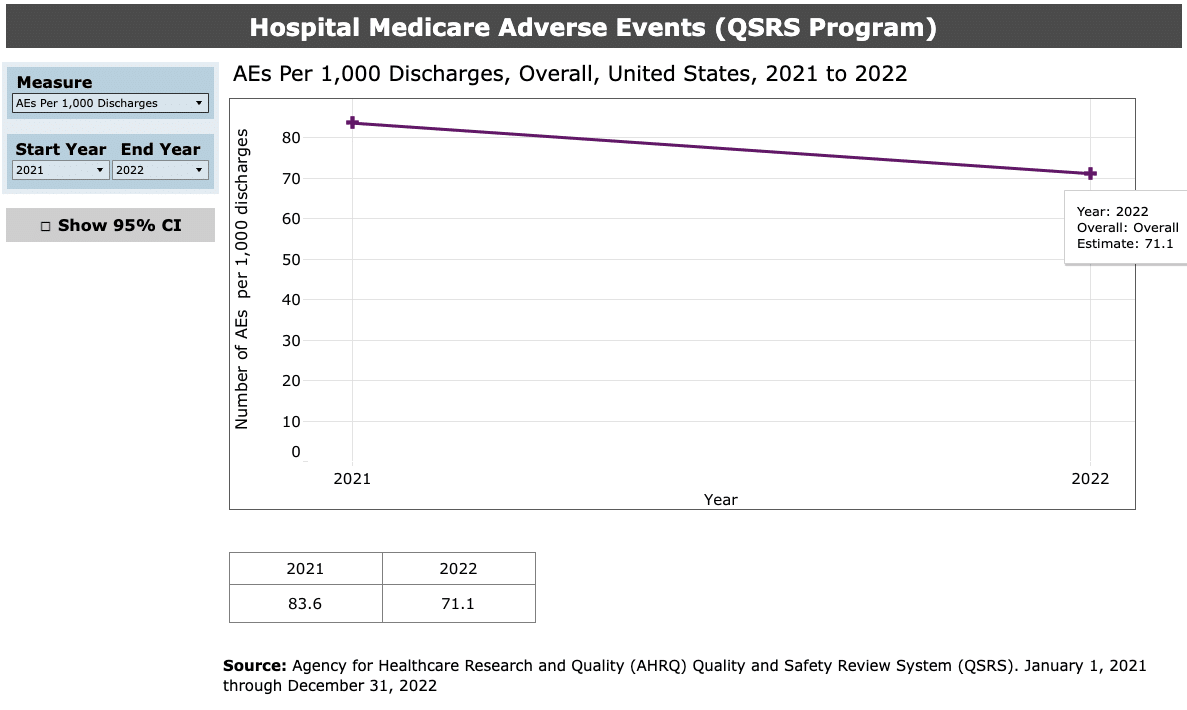
Hospital Medicare Adverse Events
One of the briefer data sets on the Safety Dashboard, the adverse events page shows two levels of stratification: patients with at least one adverse event during hospitalization; and total adverse events per 1,000 discharges. In both cases, the number of events showed favorable progress between 2021 and 2022, the latest year of available data. The cumulative number of adverse events per 1,000 discharges, for instance, fell from about 83.6 to 71.1.
Adverse events were identified using AHRQ’s Quality and Safety Review System (QSRS) to abstract information from hospital records. Measures include composite adverse event rates.
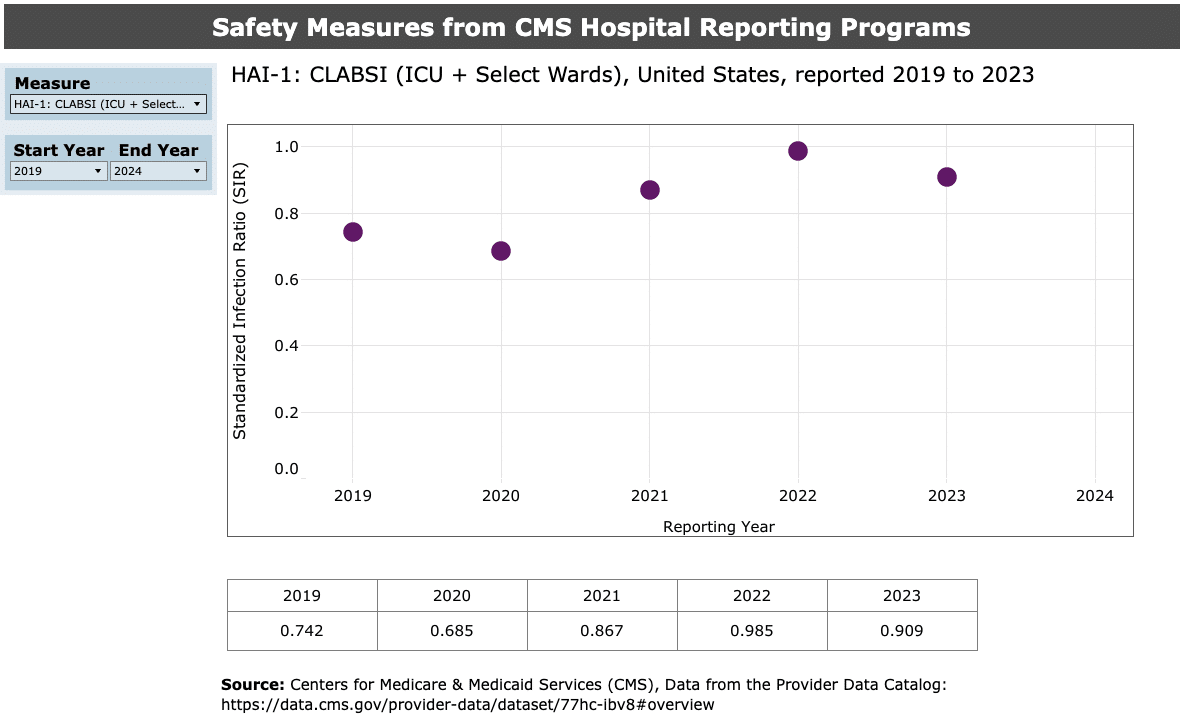
CMS Hospital Reporting Program Safety Measures
The safety performance data segment of the dashboard contains seven sub-elements, from hospital-associated infections to surgical site infections and complications. This portion of the dashboard contains some of the most recent data available, ending in calendar year 2024. The full list covers:
- Central-line associated bloodstream infections: Intensive care unit plus select wards (HAI-1)
- Catheter-associated urinary tract infections: ICU only (HAI-2)
- Surgical site infection: Colon surgery (HAI-3)
- Surgical site infection: Abdominal hysterectomy (HAI-4)
- Death for surgical inpatient with serious treatable complications (PSI-04)
- Complications for hip/knee replacements (COMP-HIP-KNEE)
- Appropriate care for severe sepsis/septic shock (SEP-1)
- Check out ADN’s checklists for Severe Sepsis and Septic Shock.
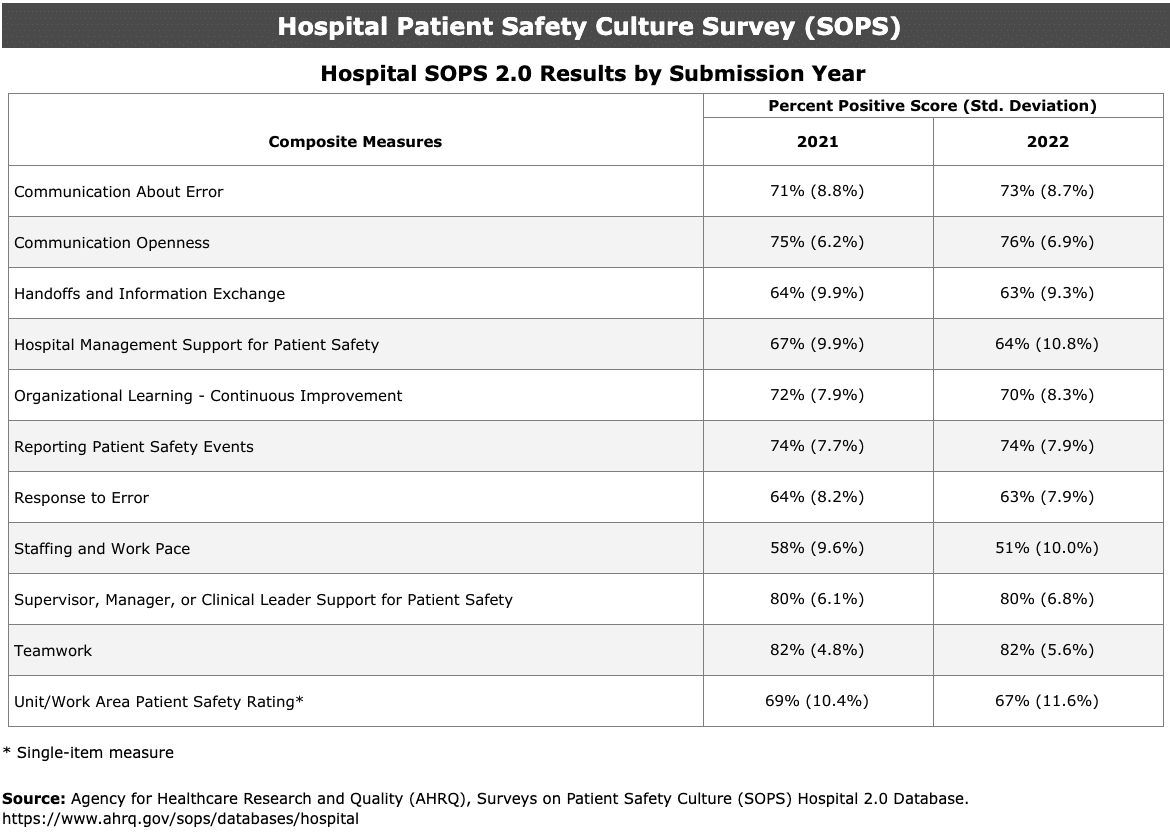
Surveys on Patient Safety Culture (SOPS) Hospital Survey
Based on the SOPS data tool, the dashboard’s survey-based data covers 11 composite measures, and compares survey results year-over-year. The SOPS tool assesses “provider and staff perceptions of patient safety culture.” Within the dashboard, the covered measures include:
- Communication about error.
- Communication openness.
- Handoffs and information exchange.
- Hospital management support for patient safety.
- Organizational learning – continuous improvement.
- Reporting patient safety events.
- Response to error.
- Staffing and workplace.
- Supervisor, manager or clinical leader support for patient safety.
- Teamwork.
- Unit/work area patient safety rating.