What is Patient Safety Event Reporting?
Patient safety event reporting refers to the systematic process in which healthcare staff document incidents that cause or have the potential to cause patient harm. This process allows for detailed data analysis that can lead to improved care and prevention of future harm. Event reporting can be done through various methods, including third-party applications, EHR-embedded tools, and even manual paper processes.
Table of Contents
- Background
- The Importance of Deep-Dive Analyses in Patient Safety Data
- The Need for Proactive Approaches in Patient Safety Data Analysis
- How to Categorize Patient Safety Data
- The Impact of Subcategories in Patient Safety Data
- Death and the Pareto Principle (80/20 Rule)
- Validating the Trends
- Miscategorization of Events as “Other Other”
- Key Takeaways and Suggested Action Items
Background
In 2018, the American Data Network Patient Safety Organization (ADNPSO) conducted an in-depth patient safety data analysis of the event type “Other.” Over a four-year period, this catchall category accounted for over 40% of events reported by ADNPSO members. Among the myriad of striking revelations, the mortality rate of incidents categorized as “Other” was 3 times higher than ALL remaining event categories combined.
The insights gained from this data analysis were so compelling that ADNPSO was selected to present at the National Association for Healthcare Quality (NAHQ) Next Conference in November 2018. The results highlight the valuable knowledge often buried in the “Other” event category and underscore the need for improved categorization and review processes.
The Importance of Deep-Dive Analyses in Patient Safety Data
As part of its mission, ADNPSO conducts deep-dive analyses to continuously enhance its understanding of patient safety data and share best practices with its members. Among patient safety events submitted through ADN’s Patient Safety Event Reporting Application, the event type “Other” consistently ranks as one of the most frequently reported categories. Understanding the value of capturing near misses is crucial for improving patient safety. ADNPSO encourages hospitals to adopt initiatives like the good catch initiative, which empowers organizations to report and address near misses more effectively, preventing future harm.
Between April 2014 and May 2018, ADNPSO’s patient safety data analysis revealed that “Other” accounted for over 40% of all submitted events. This trend mirrors what other PSOs across the country are experiencing. The “Other” category tends to function as a catchall for events that do not align with the standardized types established by the Agency for Healthcare Research and Quality (AHRQ) Common Formats.
Due to the lack of a national definition or standardized data collection for “Other” events, much of the data captured is narrative in nature. This creates challenges for analysis, potentially leading to missed opportunities to identify risks and improve patient safety.
ADNPSO undertook this project to refine the management process for “Other” events, with the aim of helping members better identify and prioritize emerging subcategories. By doing so, they could more effectively analyze vulnerabilities, identify improvement opportunities, and ensure sustainable patient safety practices.
The Need for Proactive Approaches in Patient Safety Data Analysis
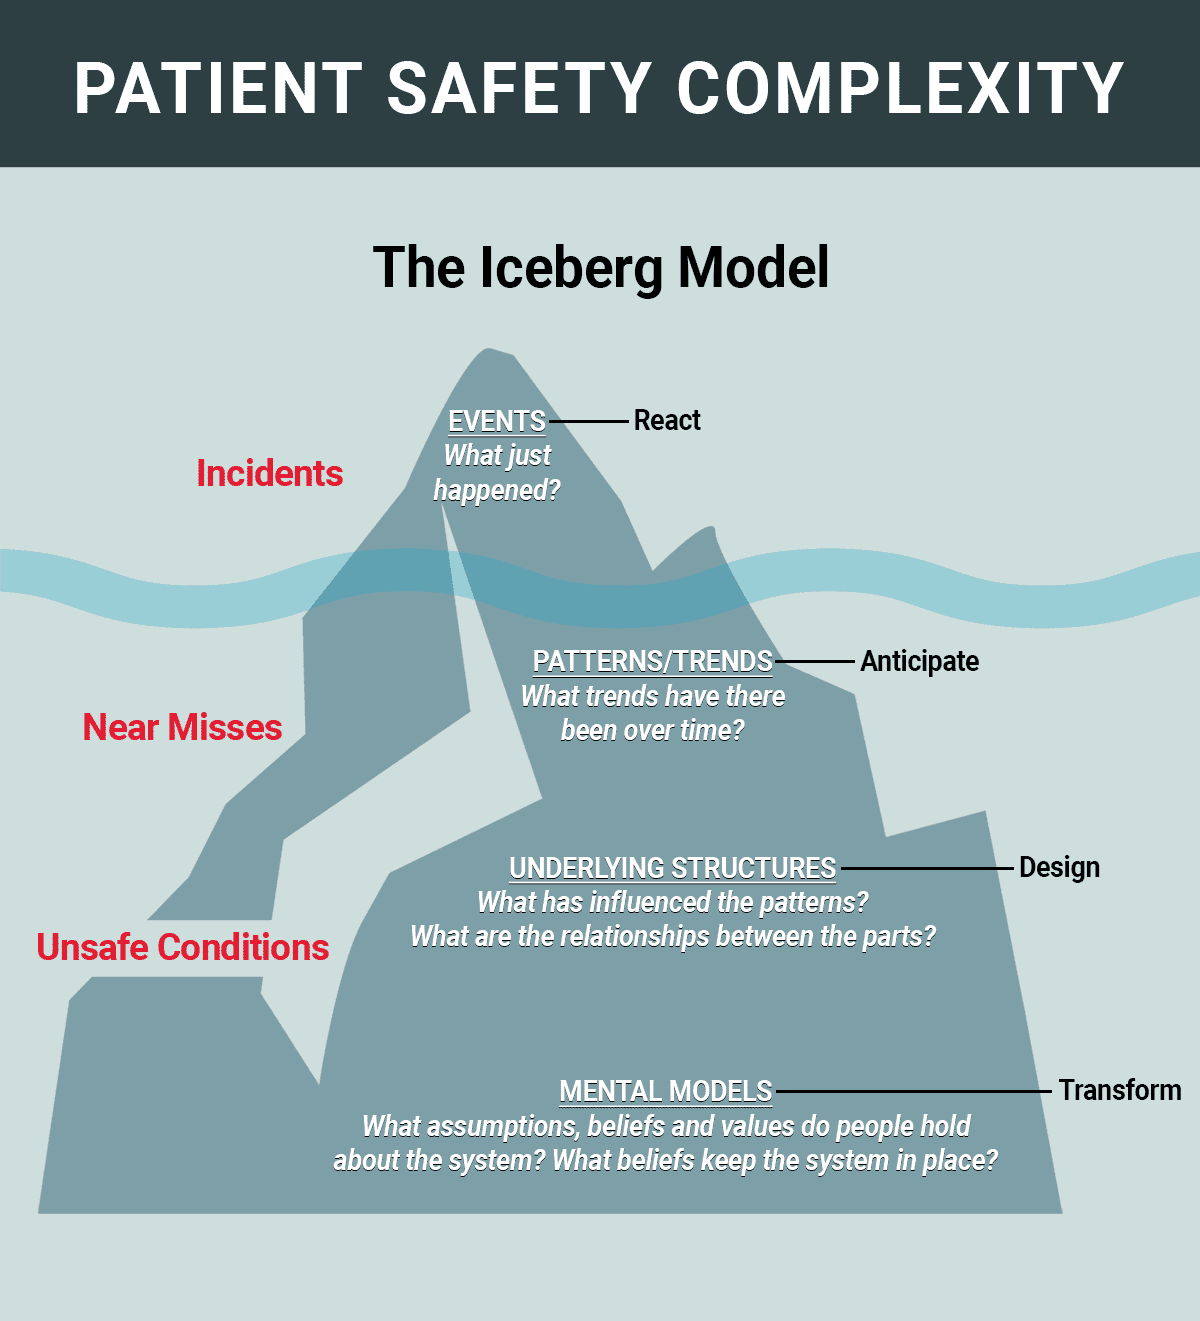
Patient safety incidents, near misses, and unsafe conditions occur constantly throughout healthcare organizations, whether or not facilities are aware of most of them. The Iceberg model, long used in healthcare to guide systemic thinking, illustrates this concept: what is visible above the waterline represents only a small fraction of the problem, with the real depth lying beneath the surface. This unseen portion includes near misses and unsafe conditions, which often reveal fractured systems and processes that can lead to errors.
Focusing primarily on reported incidents forces staff into a reactive posture, rushing to diagnose and fix what has already happened. Many organizations are striving for a more proactive focus by concentrating on near misses and unsafe conditions, aiming to uncover patterns and trends that influence patient safety. Implementing a good catch program can support this shift towards proactive patient safety management. These insights drive improvements in underlying systems and processes before incidents occur.
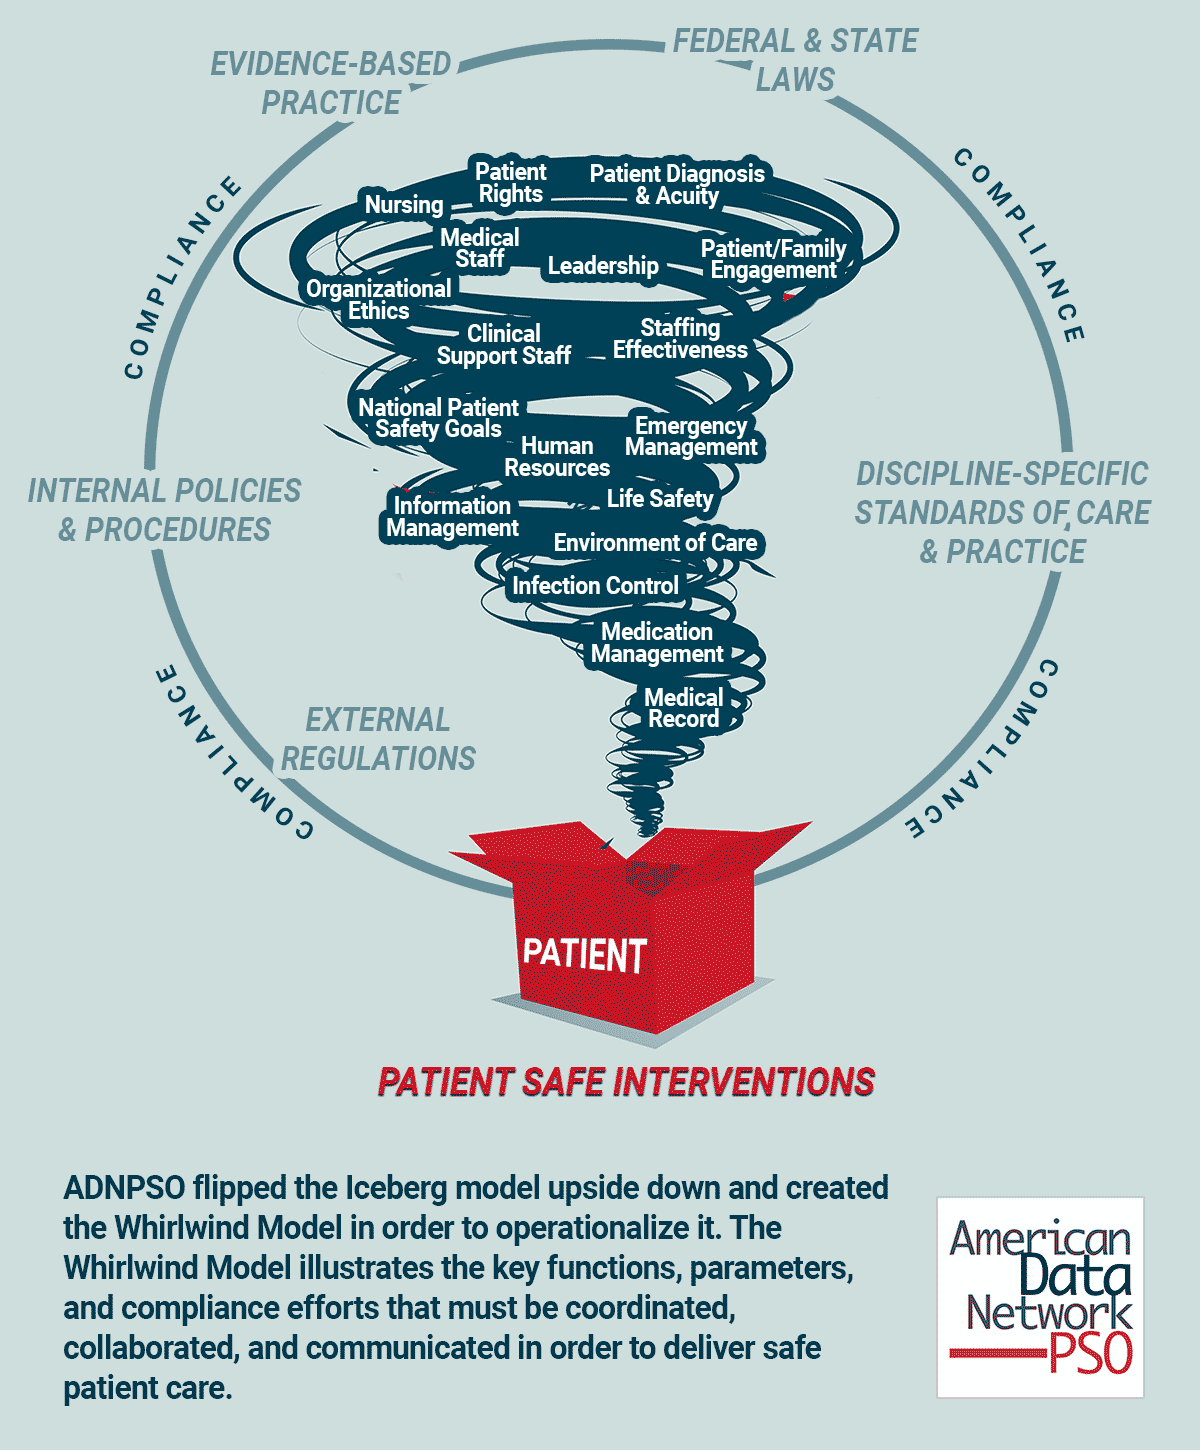
In its patient safety data analysis, ADNPSO flipped the Iceberg model upside down, developing the Whirlwind Model to better operationalize patient safety efforts. The Whirlwind Model emphasizes the coordination, collaboration, and communication necessary to ensure compliance and the delivery of safe patient care.
There is no straight line from admission to discharge as patients are continuously impacted by all the blowing whirlwinds; i.e., interactions with multiple healthcare professionals and navigation through thousands of process steps that create fertile ground for defects and errors. To mitigate patient risk and harm, healthcare organizations must embrace this complexity and execute well-coordinated, targeted care. A critical first step is accurately categorizing patient safety data to reveal fractured systems and processes that may otherwise remain hidden.


How to Categorize Patient Safety Data
To standardize the collection of patient safety data, the AHRQ Common Formats capture three main categories: incidents, near misses, and unsafe conditions. For insights into the essential data reports every patient safety department should build, refer to the top 5 patient safety reports that can guide your data analysis.
- An incident is a safety event that reached the patient, regardless of harm.
- A near miss is an event that did not reach the patient.
- An unsafe condition is a circumstance that increases the probability of a safety event occurring.
In addition, AHRQ’s Common Formats define 8 standard event types, excluding “Other”:
- Blood or Blood Product
- Fall
- Medication and Other Substance
- Device or Medical/Surgical Supply, including Health Information Technology
- Healthcare Associated Infection
- Perinatal
- Pressure Ulcer
- Surgery or Anesthesia
ADNPSO’s deep-dive patient safety data analysis began by examining the significant concentration of events classified under the “Other” category over a 4-year period.
As the “Other” event type accounted for 43.56% of all reported events, it became critical to better understand the data and aggregate similar events wherever possible for learning purposes. ADN’s event reporting application captures detailed information on preventability, and the analysis revealed that 62.12% of these “Other” events were almost certainly or likely preventable.

The Impact of Subcategories in Patient Safety Data
One of the most remarkable findings from the patient safety data analysis performed by ADNPSO was that the mortality rate of incidents categorized as “Other” was 3 times higher than ALL remaining event types combined.
In 2014, ADNPSO conducted an extensive analysis of the catchall “Other” event type, identifying reporting trends and creating subcategories in its event reporting application for more granular analysis. This resulted in the creation of 33 subcategories to allow providers to better isolate and understand incidents that do not fit within the standards of the AHRQ Common Formats.
Between April 2014 and May 2018, the subcategory “Other Other” accounted for 20.56% of the reported events, followed by “Specimens” at 16.03%. This data led ADNPSO to establish “Specimens” as a separate event type to prioritize it for better analysis and management.
It’s important to consider the subcategories with lower reporting volumes but higher risk potential. It raises questions about the reporting culture or the staff’s understanding of what constitutes a safety event. This analysis can lead to the revelation of the need for more education around the definitions of the subcategories so frontline staff doesn’t default to the path of least resistance and use the “Other Other” subcategory.
A good example of how frontline staff’s perception of event categorization can affect your data is the subcategory Telemetry, which only accounted for 2.52% of all subcategories. Does staff not recognize Telemetry issues as a patient safety event? Or are those being reported but buried in the “Other Other” subcategory?
For Patient Safety and Risk Managers, it is common practice to focus on high-volume events. However, low-volume, high-risk events should also be a regular target of focus, as they often carry the most significant consequences for patient outcomes.
Death and the Pareto Principle (80/20 Rule)
When evaluating areas for improvement, healthcare quality teams can maximize their impact by applying the Pareto Principle, also known as the 80/20 rule. This rule suggests that approximately 80% of outcomes stem from just 20% of causes. In the context of patient safety data analysis, this approach helps organizations focus their efforts where they can achieve the greatest return.
A significant application of this principle emerged when ADNPSO analyzed incidents where the Final Harm Level was Death. Between April 2014 and May 2018, 83.05% of all deaths reported occurred in just three event types: Other, Healthcare Associated Infections, and Surgery or Anesthesia.
One of the most striking discoveries from the patient safety data analysis was that deaths resulting from incidents categorized as “Other” were almost 3X HIGHER than those from all remaining event types combined.
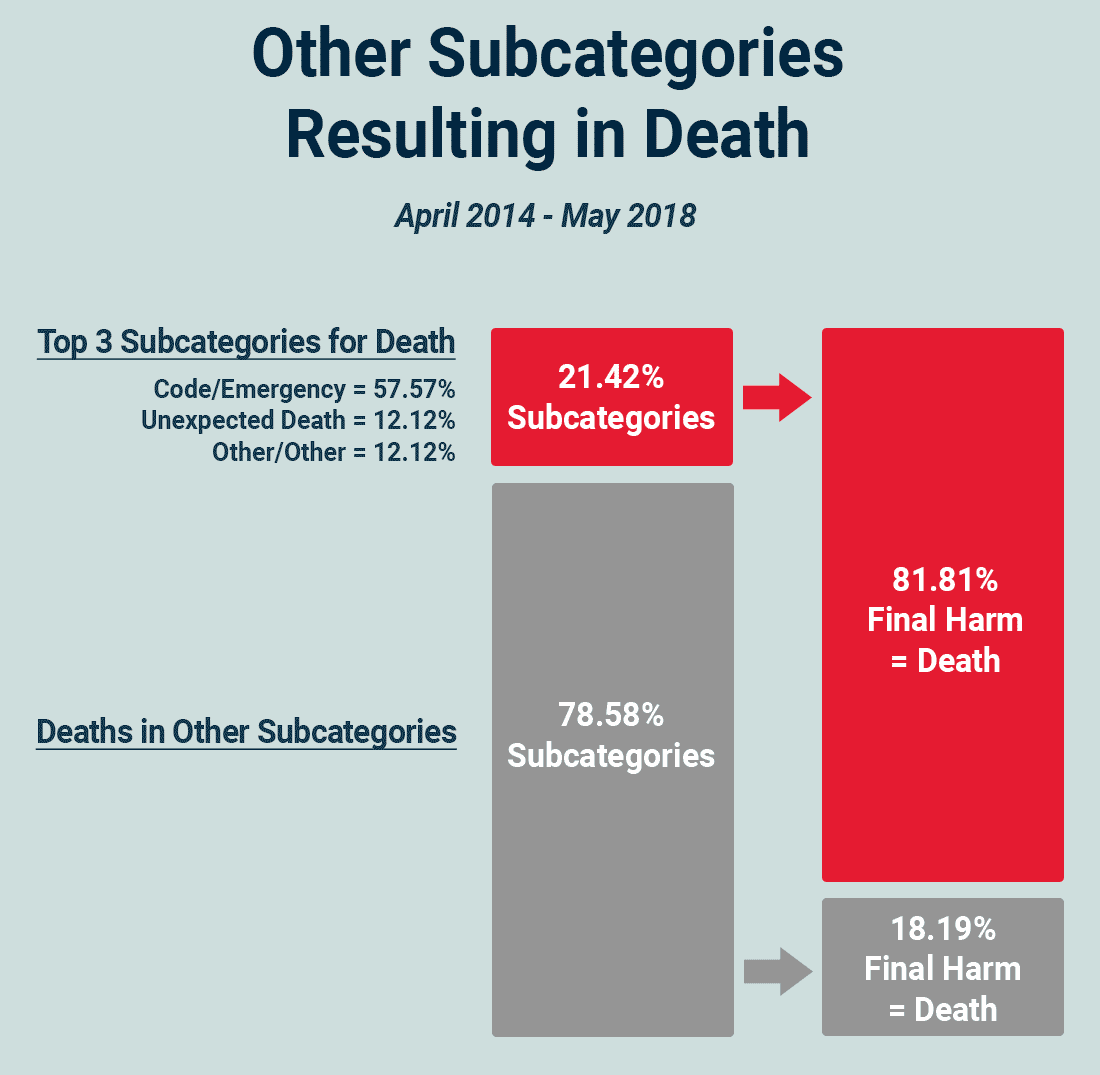
To delve deeper, ADNPSO further analyzed the “Other” category and found that 81.81% of deaths in this category could be attributed to just three subcategories: Code/Emergency, Unexpected Death, and “Other Other“. This suggests that focusing on just 21.42% (3 out of 14) of the subcategories with deaths will likely deliver the highest return on efforts, following best practices for focusing time and energy. Identifying areas for improvement using the Pareto Principle can often bring high ROI with just small changes.

To gain further insight into deaths in the “Other” category, ADNPSO examined these subcategories by department and discovered that five department types were responsible for 84.45% of the deaths. Additionally, evaluating the time of day when these deaths occurred at the departmental level could help identify patterns or specific unit-related factors that correlate with higher mortality rates.
Validating the Trends
To validate the four-year findings, ADNPSO conducted a thorough review of data from CY 2018. The objective was to confirm whether the trends identified in the initial patient safety data analysis persisted in the most recent data set and to uncover any new insights. The team ran aggregate reports for CY 2018 and manually reviewed 500 randomly selected “Other Other” events through narrative analysis.
The comparison between the two time frames revealed that “Other” remained the most frequently reported event type in CY 2018, followed by Medication, Falls, and Surgery/Anesthesia. The subcategory analysis showed no major shifts from the earlier data set, with the highest reported subcategories continuing to be “Other”, Specimens, Delay in Treatment, and Failure to Follow Policy/Order.
Furthermore, more than 50% of the incidents were still reported as preventable. While most of the events did not result in harm, the trend of “Other” events having a mortality rate 3x higher than all other events remained consistent, underscoring the critical importance of this patient safety data analysis.
To ensure comprehensive event reporting in your organization, consider using a patient safety event reporting guide to refine your data collection processes.
Miscategorization of Events as “Other Other”
In the review of 500 randomly selected “Other Other” event narratives, ADNPSO found that 70% (or 346) of these events should have been recategorized into more specific subcategories or event types. If these 346 events were properly recategorized, it would shift the ranking of patient safety subcategories and provide a more accurate representation of incident types.
For teams using the Pareto Principle (80/20 Rule) to prioritize time and resources, events that are miscategorized and hidden within the “Other” category may be distorting the data. This means that your organization may not be focusing on the highest-priority areas. Risk Managers should thoroughly review and appropriately categorize events before closing them to ensure more accurate data prioritization. ADNPSO also recommends using these instances of miscategorization as educational opportunities for frontline staff to prevent future errors.
Strikingly, nearly all of the “Other” events that resulted in death were miscategorized. Of the 500 random “Other Other” events reviewed, 7 resulted in death, and 6 of the 7 warranted recategorization to more specific subcategories such as Delay in Treatment, Code/Emergency or Medications.
Key Takeaways and Suggested Action Items
The goal of ADNPSO’s analysis of the “Other” event category was to identify the types of patient safety issues captured within this catchall category, aggregate similar events for learning purposes, improve future data collection efforts, and isolate key issues that individual organizations should address.
Key Takeaways
- The most critical insight from this patient safety data analysis is the immense potential within the “Other” event category, particularly given that incidents in this category could have a mortality rate 3X higher than all other event types combined.
- Patient Safety and Risk Managers should dedicate time to reviewing and recategorizing “Other” events before they are closed and incorporated into analytics reports. This ensures the team is focused on the correct priorities.
- Organizations relying on manual processes, EHR add-on modules, or in-house built databases may miss key opportunities for identifying patient safety trends. Manual data entry takes up valuable time that could be better spent on data analysis and improvement efforts. If your organization is looking for more efficient systems, contact our team to learn more about ADN’s event reporting application and the analytics it can provide.
Suggested Action Items
- Stratify organizational data by Incidents, Near Misses, and Unsafe Conditions, and compare it to the Iceberg and Whirlwind models for deeper insights.
- Run an Event Distribution analysis to determine whether “Other” ranks among the most reported event types. Apply the Pareto Rule to focus on the most impactful areas.
- Conduct deep dives into the “Other” category to aggregate like events into subcategories, prioritize emerging topics, and evaluate for miscategorization and mortality trends.
- Examine Final Harm Distribution for “Other” events and compare it to the Final Harm for all other event types combined.
- Establish multidisciplinary teams with subject matter experts to address the various safety issues identified within the “Other” category.
- Communicate findings and recommendations from your deep-dive analyses to all staff using multiple communication channels.
- Utilize improvement tools, such as Rapid Cycle PDSA (Plan-Do-Study-Act), to implement and sustain meaningful changes.


